EUR/USD
Analysis:
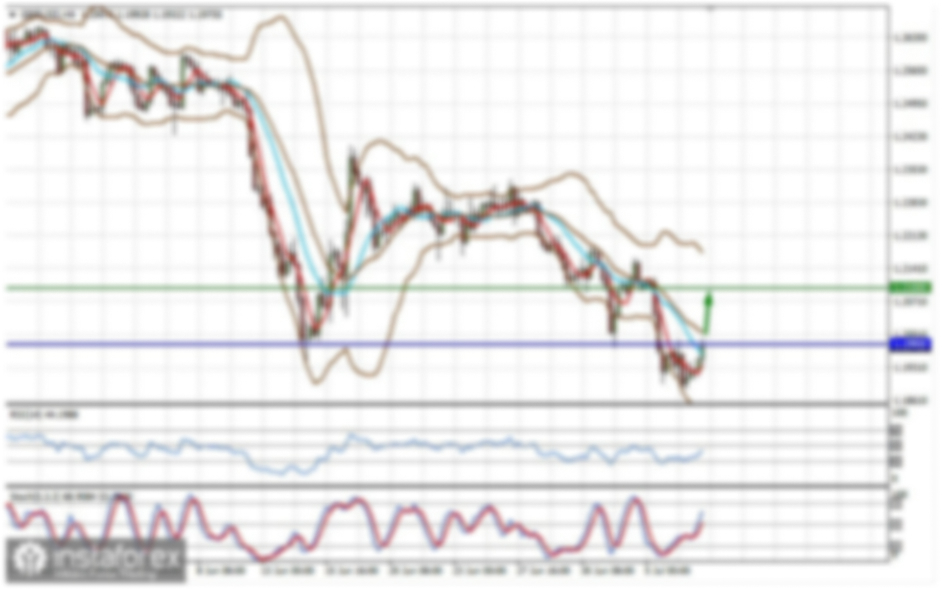
Since last summer, the quotes of the main European currency pair have been forming a descending horizontal pennant. From a powerful potential reversal zone on the daily time frame, the price moved upwards in mid-April, forming a correction of the last segment of the main wave. The structure of this segment still needs to be completed.
Forecast:
In the upcoming week, the euro's general sideways movement is expected to continue. Early in the week, there may be brief pressure on the resistance zone, followed by a potential reversal and resumption of the bearish trend. The most active phase of upward movement is likely towards the weekend.
Potential Reversal Zones:
- Resistance: 1.0900/1.0950
- Support: 1.0710/1.0660
Recommendations:
- Buying: No conditions for such trades next week.
- Selling: It is optimal to wait for the current rise to complete and open a trade near the resistance zone after receiving corresponding signals on your trading systems.
USD/JPY
Analysis:
The analysis of the dominant bearish wave of the Japanese yen major since April shows the formation of a descending correction (B). As of the analysis, its structure is incomplete, and the middle part of the wave is developing. The calculated resistance is at the lower edge of the preliminary target zone.
Forecast:
Next week, a continuation of the general sideways movement of the pair is expected. The start of the week may be flat. Brief pressure on the upper boundary of the calculated resistance cannot be excluded in the next couple of days. In the second half of the week, expect activation and the beginning of the pair's decline.
Potential Reversal Zones:
- Resistance: 157.80/158.30
- Support: 154.70/154.20
Recommendations:
- Selling: Buyers may activate next week. The optimal entry area is the calculated resistance zone. Support limits the downside potential.
- Buying: Quite risky with low potential. It is safer to reduce the lot size.
GBP/JPY
Analysis:
The trend of the GBP/JPY pair has been upward in recent years. Since the end of April, the quotes have been forming a counter-correction segment, which still needs to be completed. The middle part of the shifting plane is developing within the structure.
Forecast:
Over the next decade, the price is expected to move between the nearest opposing zones. Early in the week, pressure on the resistance is possible, with a brief breach of the upper boundary not excluded. After that, a decline in quotes to the calculated support is expected. The highest volatility is likely closer to the weekend.
Potential Reversal Zones:
- Resistance: 199.90/200.40
- Support: 199.40/198.90
Recommendations:
- Buying: No potential.
- Selling: This could become the main trading direction after confirmed reversal signals in the resistance zone.
USD/CAD
Analysis:
The trend in the main Canadian dollar pair has lacked a clear direction since last year. The descending segment from April 16 shows reversal potential, exceeding the previous rise's retracement level. The middle part of the wave is developing within the structure. The calculated resistance lies at the lower boundary of the potential reversal zone on the larger time frame.
Forecast:
The pair's gradual price decline is expected throughout the upcoming week. In the early days, pressure may be seen on the resistance zone, possibly breaching its upper boundary. The highest volatility and price decline are likely towards the weekend.
Potential Reversal Zones:
- Resistance: 1.3670/1.3720
- Support: 1.3550/1.3500
Recommendations:
- Selling: Premature until confirmed reversal signals appear near the support zone.
- Buying: Low potential and may be risky.
NZD/USD
Brief Analysis:
Since December last year, the quotes of the main New Zealand dollar pair have been drifting sideways. The wave extremes form a "descending plane" pattern. Analysis of its structure shows the formation of the middle segment (B) in recent months. After its completion, the descending trend will continue.
Weekly Forecast:
Early in the upcoming week, a sideways price movement along the calculated support is highly likely. In the second half, increased volatility and a resumption of the pair's upward trend are expected. Price rise during the week can be anticipated up to the calculated resistance.
Potential Reversal Zones:
- Resistance: 0.6230/0.6280
- Support: 0.6090/0.6040
Recommendations:
- Selling: No conditions for such trades.
- Buying: May become the main trade direction after confirmed signals near the support zone.
Gold
Analysis:
A descending wave has been setting the trend direction in the gold market since mid-April this year. The wave extremes form a stretched plane on the chart. The final part of the wave is developing, with an intermediate retracement forming in recent days. After its completion, the price decline will continue.
Forecast:
Early next week, a continuation of the flat price movement in gold is expected. Brief growth to the resistance zone is not excluded. The second half of the upcoming week is expected to be more volatile, with a likely reversal and price return to the support area. A break below the support's lower boundary within the upcoming week is unlikely.
Potential Reversal Zones:
- Resistance: 2370.0/2385.0
- Support: 2280.0/2265.0
Recommendations:
- Buying: Refraining from entering the market and monitoring for reversal signals is safer.
- Selling: May yield profit with proper timing within individual sessions and reduced lot size.
Notes:
- In simplified wave analysis (SWA), all waves consist of three parts (A-B-C). The last unfinished wave is analyzed on each time frame. Expected movements are shown with dashed lines.
- Warning: The wave algorithm does not account for the duration of instrument movements over time!