EUR/USD 5-Minute Analysis
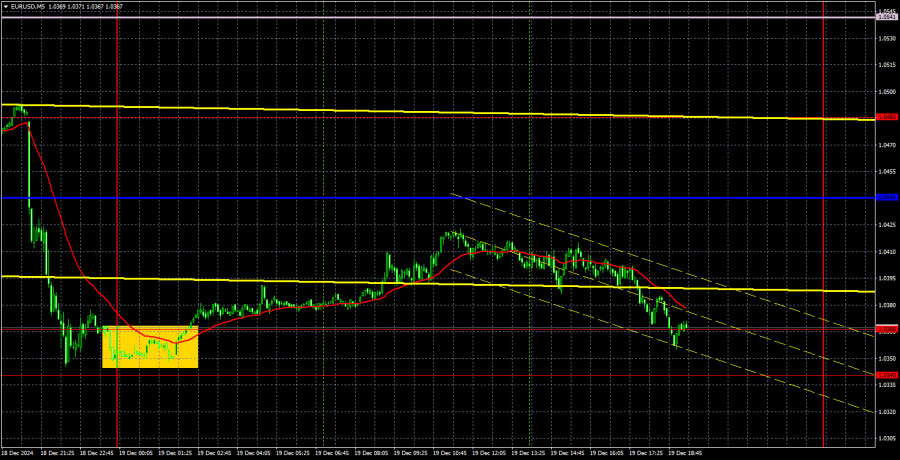
The EUR/USD currency pair traded with a firm downward bias on Wednesday and Thursday. Wednesday's movements were significantly weaker, but the market revealed its intended direction. We had assumed that, regardless of the Federal Reserve meeting's outcome, the price might initially move in one direction and then return to its starting point. However, this did not happen. The Fed meeting results were overwhelmingly hawkish, leaving no reason for the market to buy the euro. On Thursday, it was also revealed that the U.S. economy grew by 3.1% in the third quarter, surpassing the forecasted 2.8%. Thus, as we repeatedly warned, the dollar has a stronger foundation for growth than the euro. We saw a three-week correction—slow, weak, and essentially flat. But, as anticipated, this was expected. Moving forward, we foresee further declines in the euro.
As the New Year approaches, forex market activity could significantly decrease. The pair might enter a flat phase lasting several weeks. However, there are no signs of a flat trend, so there's no need to become prematurely pessimistic. If the price breaks through the 1.0340–1.0366 area, it will open the door to 1.0269. The 1.0269 level is very close to the target range of 1.00–1.02, which we have discussed since the beginning of the year.
Yesterday, only one trade signal was formed, which turned out to be a counter-trend. During the Asian trading session, the price bounced off the 1.0340–1.0366 area, rising by about 40 pips. However, it did not reach the critical line, so the only way to secure a profit from the trade was to close it manually before the U.S. trading session and the release of the positive GDP report.
COT Report
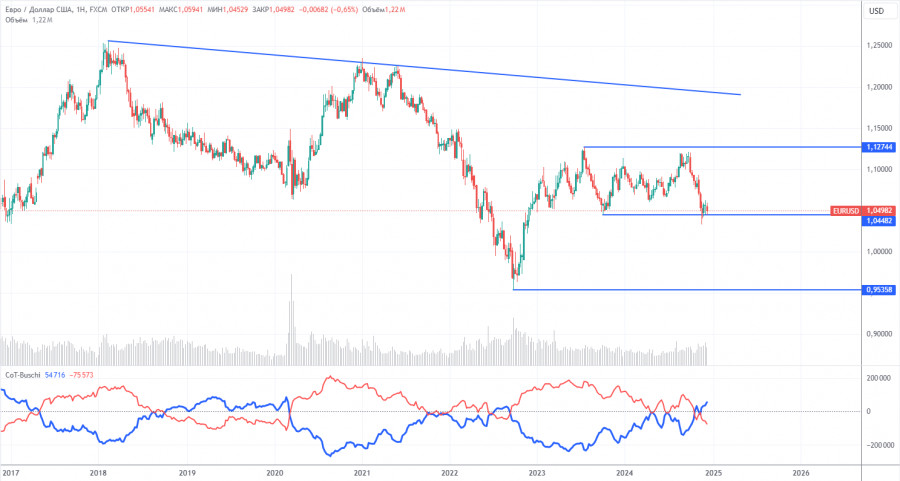
The latest COT report, dated December 10, provides a clear picture of market sentiment. As shown in the illustration above, the net position of non-commercial traders has long remained bullish, but bears have recently gained dominance. Two months ago, the number of open short positions among professional traders increased sharply, turning the net position negative for the first time in a long while. This indicates that the euro is now being sold more often than bought.
We still see no fundamental factors supporting the euro's strengthening, and technical analysis indicates the price is in a consolidation zone—essentially, a flat market. On the weekly timeframe, it's clear that since December 2022(!!!), the pair has been trading between 1.0448 and 1.1274. Therefore, a further decline remains more likely. Breaking below the 1.0448 level will open new territory for a euro sell-off.
The red and blue lines have crossed and switched positions relative to one another, signaling a bearish trend in the market. During the last reporting week, the number of longs in the non-commercial group decreased by 10,300, while shorts increased by 7,700. As a result, the net position fell by another 18,000.
EUR/USD 1-Hour Analysis
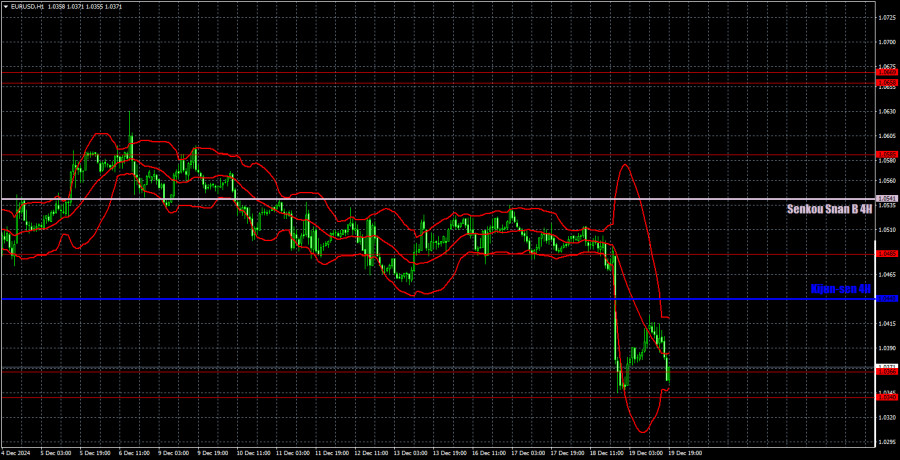
In the hourly timeframe, the pair has completed a three-week correction and resumed its downward movement. We believe the decline could continue in the coming days, as the Fed's stance has proven to be very hawkish. It was revealed that the Fed may only reduce the interest rate 1–2 times in 2025, which is significantly more hawkish than the scenario already priced in by the market. We still maintain that there are no substantial reasons for a strong rise in the euro.
For December 20, we highlight the following trading levels: 1.0269, 1.0340–1.0366, 1.0485, 1.0585, 1.0658–1.0669, 1.0757, 1.0797, 1.0843, 1.0889, 1.0935, as well as the Senkou Span B (1.0541) and Kijun-sen (1.0440) lines. The Ichimoku indicator lines may shift throughout the day, which should be considered when identifying trading signals. Remember to set a Stop Loss order at breakeven if the price moves 15 pips in the right direction. This will protect against potential losses if the signal turns out to be false.
On Friday, no significant data is scheduled in the Eurozone, while in the U.S., reports on the PCE index, personal income and spending, and the University of Michigan Consumer Sentiment Index will be published. In our view, all of these are secondary data points.
Illustration Explanations:
Support and Resistance Levels (thick red lines): Key areas where price movement might stall. Not sources of trading signals.
Kijun-sen and Senkou Span B Lines: Ichimoku indicator lines transferred from the H4 timeframe to the hourly chart, serving as strong levels.
Extreme Levels (thin red lines): Points where the price has previously rebounded. They can serve as trading signal sources.
Yellow Lines: Trendlines, channels, or other technical patterns.
Indicator 1 on COT Charts: Reflects the net position size of each trader category.


