empty
14.11.2023 10:30 AM
EUR/USD and GBP/USD: Trading plan for beginner traders on November 14, 2023

Details of the Economic Calendar on November 13

Monday, as usual, was accompanied by an empty macroeconomic calendar. Important statistical data were not published in the European Union, the United Kingdom, and the United States.

Analysis of Trading Charts from November 13

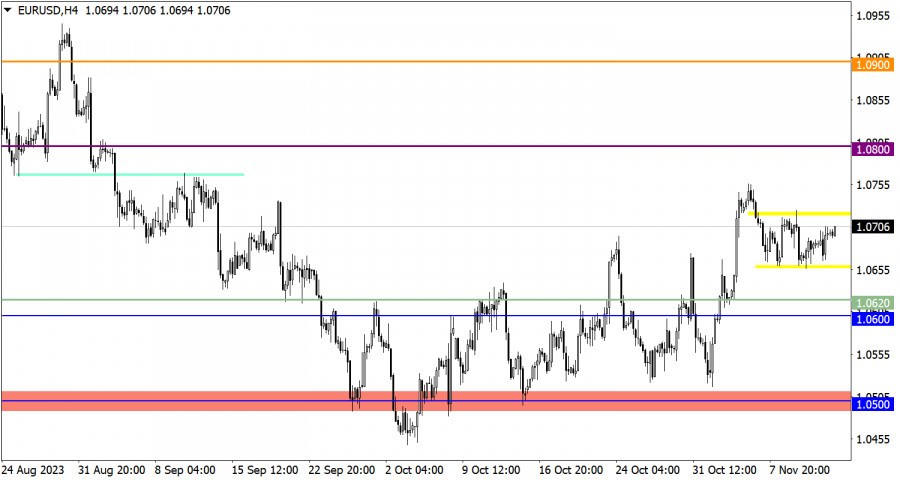
The EURUSD currency pair has been trading in a sideways range within 50-70 points for a week. There are no radical changes, and it seems that the quote is in the process of accumulating trading forces.

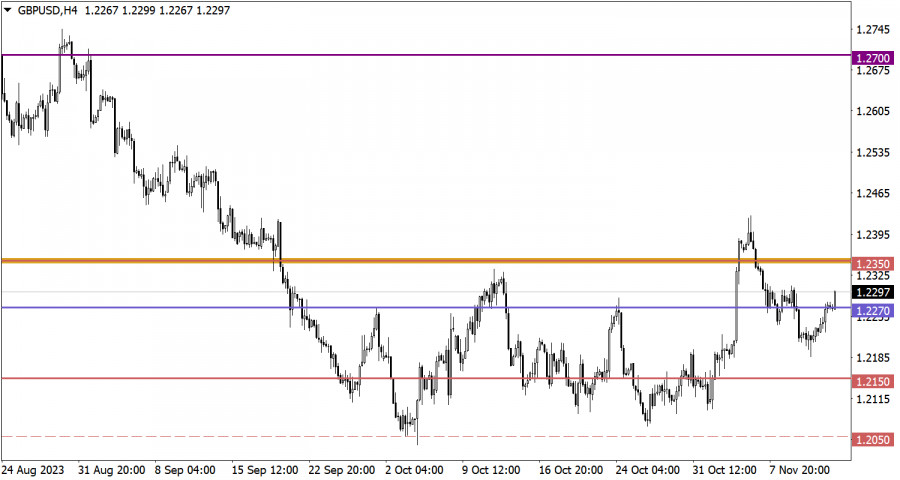
The GBP/USD currency pair bounced off the level of 1.2200, leading to an increase in long positions. As a result, the quote rose above the level of 1.2270.

This image is no longer relevant

Economic Calendar for November 14

Data on the UK labor market were published at the opening of the European trading session, indicating the unemployment rate remaining at 4.2% against the forecast of an increase to 4.3%. The number of employed in September increased by 54,000 people, while a decrease of 198,000 was expected. These labor market data turned out to be better than forecasts, leading to further strengthening of the British pound.

The key event on Tuesday, and possibly for the entire week, is the inflation data in the United States, which may decline from 3.7% to 3.3%. These indicators may indicate a final shift in the policy of the Federal Reserve, where the refinancing rate will no longer be raised at the upcoming meetings.

EUR/USD Trading Plan for November 14

In this situation, we have two key levels: the first is at the level of 1.0650, which is considered in a bearish scenario, and the second is at the level of 1.0750. A breakout of the 1.0750 level would indicate a continuation of the upward cycle.

This image is no longer relevant

GBP/USD Trading Plan for November 14

If the price stabilizes above the level of 1.2300, it may trigger further growth in long positions towards 1.2350-1.2400. In this case, the previous upward cycle in the market may resume, leading to the update of the local high. However, if the price does not hold above 1.2270, it may cause a new wave of decline, where the level of 1.2270 will become resistance.

This image is no longer relevant

What's on the charts

The candlestick chart type is white and black graphic rectangles with lines above and below. With a detailed analysis of each individual candle, you can see its characteristics relative to a particular time frame: opening price, closing price, intraday high and low.

Horizontal levels are price coordinates, relative to which a price may stop or reverse its trajectory. In the market, these levels are called support and resistance.

Circles and rectangles are highlighted examples where the price reversed in history. This color highlighting indicates horizontal lines that may put pressure on the asset's price in the future.

The up/down arrows are landmarks of the possible price direction in the future.

Gven Podolsky,
الخبير التحليلي لدى شركة إنستافوركس
© 2007-2025
حدد الإطار الزمني
5
د
15
د
30
د
1
س
4
ساعات
1
يوم
1
أسبوع
كسب عائد من تغيرات أسعار العملات المشفرة مع إنستافوركس.
قم بتحميل منصة التداول ميتاتريدر 4 وافتح أول صفقة.
  • Grand Choice
    Contest by
    InstaForex
    InstaForex always strives to help you
    fulfill your biggest dreams.
    انضم إلى المسابقة

المقالات الموصى بها

كيفية تداول زوج الجنيه الإسترليني/الدولار الأمريكي في 21 أبريل؟ نصائح بسيطة وتحليل التداول للمبتدئين

يوم الجمعة، أظهر زوج الجنيه الإسترليني/الدولار الأمريكي تقلبًا منخفضًا للغاية، ومع ذلك ارتفع الجنيه الإسترليني بشكل مطرد حتى في ظل هذه الظروف السوقية. في الواقع، خلال الأسبوع الماضي، انخفض السعر

Paolo Greco 05:36 2025-04-21 UTC+2

كيفية تداول زوج اليورو/الدولار الأمريكي في 21 أبريل؟ نصائح بسيطة وتحليل التداول للمبتدئين

لم يشهد زوج العملات EUR/USD أي حركة يوم الجمعة. كان ذلك يوم الجمعة العظيمة، وتلاه عيد الفصح يوم الأحد. ونتيجة لذلك، احتفلت العديد من الدول بعطلات رسمية، وأُغلقت الأسواق المالية

Paolo Greco 05:36 2025-04-21 UTC+2

توصيات وتحليل التداول لزوج الجنيه الإسترليني/الدولار الأمريكي في 21 أبريل: ارتفاع الجنيه حتى في العطلات

تداول زوج العملات GBP/USD بارتفاع مرة أخرى يوم الجمعة، وإن كان ذلك مع تقلبات طفيفة. على الرغم من عدم وجود أحداث مهمة في الولايات المتحدة أو المملكة المتحدة

Paolo Greco 04:01 2025-04-21 UTC+2

توصيات وتحليل التداول لزوج اليورو/الدولار الأمريكي في 21 أبريل: عيد الفصح والسوق المستقر

في يوم الجمعة، بقي زوج العملات EUR/USD مستقرًا بشكل أساسي. بحلول نهاية اليوم، كان اليورو قد ارتفع بحوالي 20 نقطة، لكن التقلبات بشكل عام كانت شبه معدومة طوال اليوم

Paolo Greco 04:01 2025-04-21 UTC+2

كيفية تداول زوج الجنيه الإسترليني/الدولار الأمريكي في 18 أبريل؟ نصائح بسيطة وتحليل التداول للمبتدئين

واصل زوج الجنيه الإسترليني/الدولار الأمريكي التداول بارتفاع طوال يوم الخميس. حتى في أعلى مستوياته، لا يظهر الجنيه الإسترليني أي نية للتصحيح. لم تكن هناك أحداث بارزة في المملكة المتحدة أمس،

Paolo Greco 06:51 2025-04-18 UTC+2

كيفية تداول زوج اليورو/الدولار الأمريكي في 18 أبريل؟ نصائح بسيطة وتحليل التداول للمبتدئين

واصل زوج العملات EUR/USD التداول ضمن قناة جانبية يوم الخميس، كما هو موضح في الرسم البياني للإطار الزمني الساعي أعلاه. الوضع الحالي في السوق بسيط للغاية. بالأمس، عقد البنك المركزي

Paolo Greco 06:51 2025-04-18 UTC+2

توصيات وتحليل التداول لزوج الجنيه الإسترليني/الدولار الأمريكي في 18 أبريل: الجنيه الإسترليني يفقد زخمه

واصل زوج العملات GBP/USD حركته الصعودية يوم الخميس، متداولًا بالقرب من أعلى مستوياته في عدة سنوات. وعلى الرغم من عدم وجود أحداث كبيرة في الولايات المتحدة أو المملكة المتحدة (على

Paolo Greco 03:48 2025-04-18 UTC+2

توصيات وتحليل التداول لليورو/الدولار الأمريكي في 18 أبريل: البنك المركزي الأوروبي فشل في تحريك السوق

واصل زوج العملات EUR/USD التداول بشكل جانبي يوم الخميس. بينما كان يتحرك سابقًا ضمن نطاق بين 1.1274 و1.1391، كان يوم الخميس عالقًا في حالة استقرار مطلق بالقرب من الحد العلوي

Paolo Greco 03:48 2025-04-18 UTC+2

GBP/USD: خطة التداول للجلسة الأمريكية في 17 أبريل (مراجعة تداولات الصباح)

في توقعاتي الصباحية، ركزت على مستوى 1.3239 وخططت لاتخاذ قرارات الدخول بناءً عليه. دعونا نلقي نظرة على الرسم البياني لمدة 5 دقائق ونرى ما حدث. تشكل ارتفاع وكسر زائف

Miroslaw Bawulski 18:53 2025-04-17 UTC+2

EUR/USD: خطة التداول للجلسة الأمريكية في 17 أبريل (مراجعة تداولات الصباح)

في توقعاتي الصباحية، قمت بتسليط الضوء على مستوى 1.1341 وخططت لاتخاذ قرارات دخولي إلى السوق بناءً عليه. دعونا نلقي نظرة على الرسم البياني لمدة 5 دقائق ونحلل

Miroslaw Bawulski 18:50 2025-04-17 UTC+2
لا تستطيع التحدث الآن؟
اطرح سؤالك في الدردشة.
Widget callback
 

Dear visitor,

Your IP address shows that you are currently located in the USA. If you are a resident of the United States, you are prohibited from using the services of InstaFintech Group including online trading, online transfers, deposit/withdrawal of funds, etc.

If you think you are seeing this message by mistake and your location is not the US, kindly proceed to the website. Otherwise, you must leave the website in order to comply with government restrictions.

Why does your IP address show your location as the USA?

  • - you are using a VPN provided by a hosting company based in the United States;
  • - your IP does not have proper WHOIS records;
  • - an error occurred in the WHOIS geolocation database.

Please confirm whether you are a US resident or not by clicking the relevant button below. If you choose the wrong option, being a US resident, you will not be able to open an account with InstaForex anyway.

We are sorry for any inconvenience caused by this message.